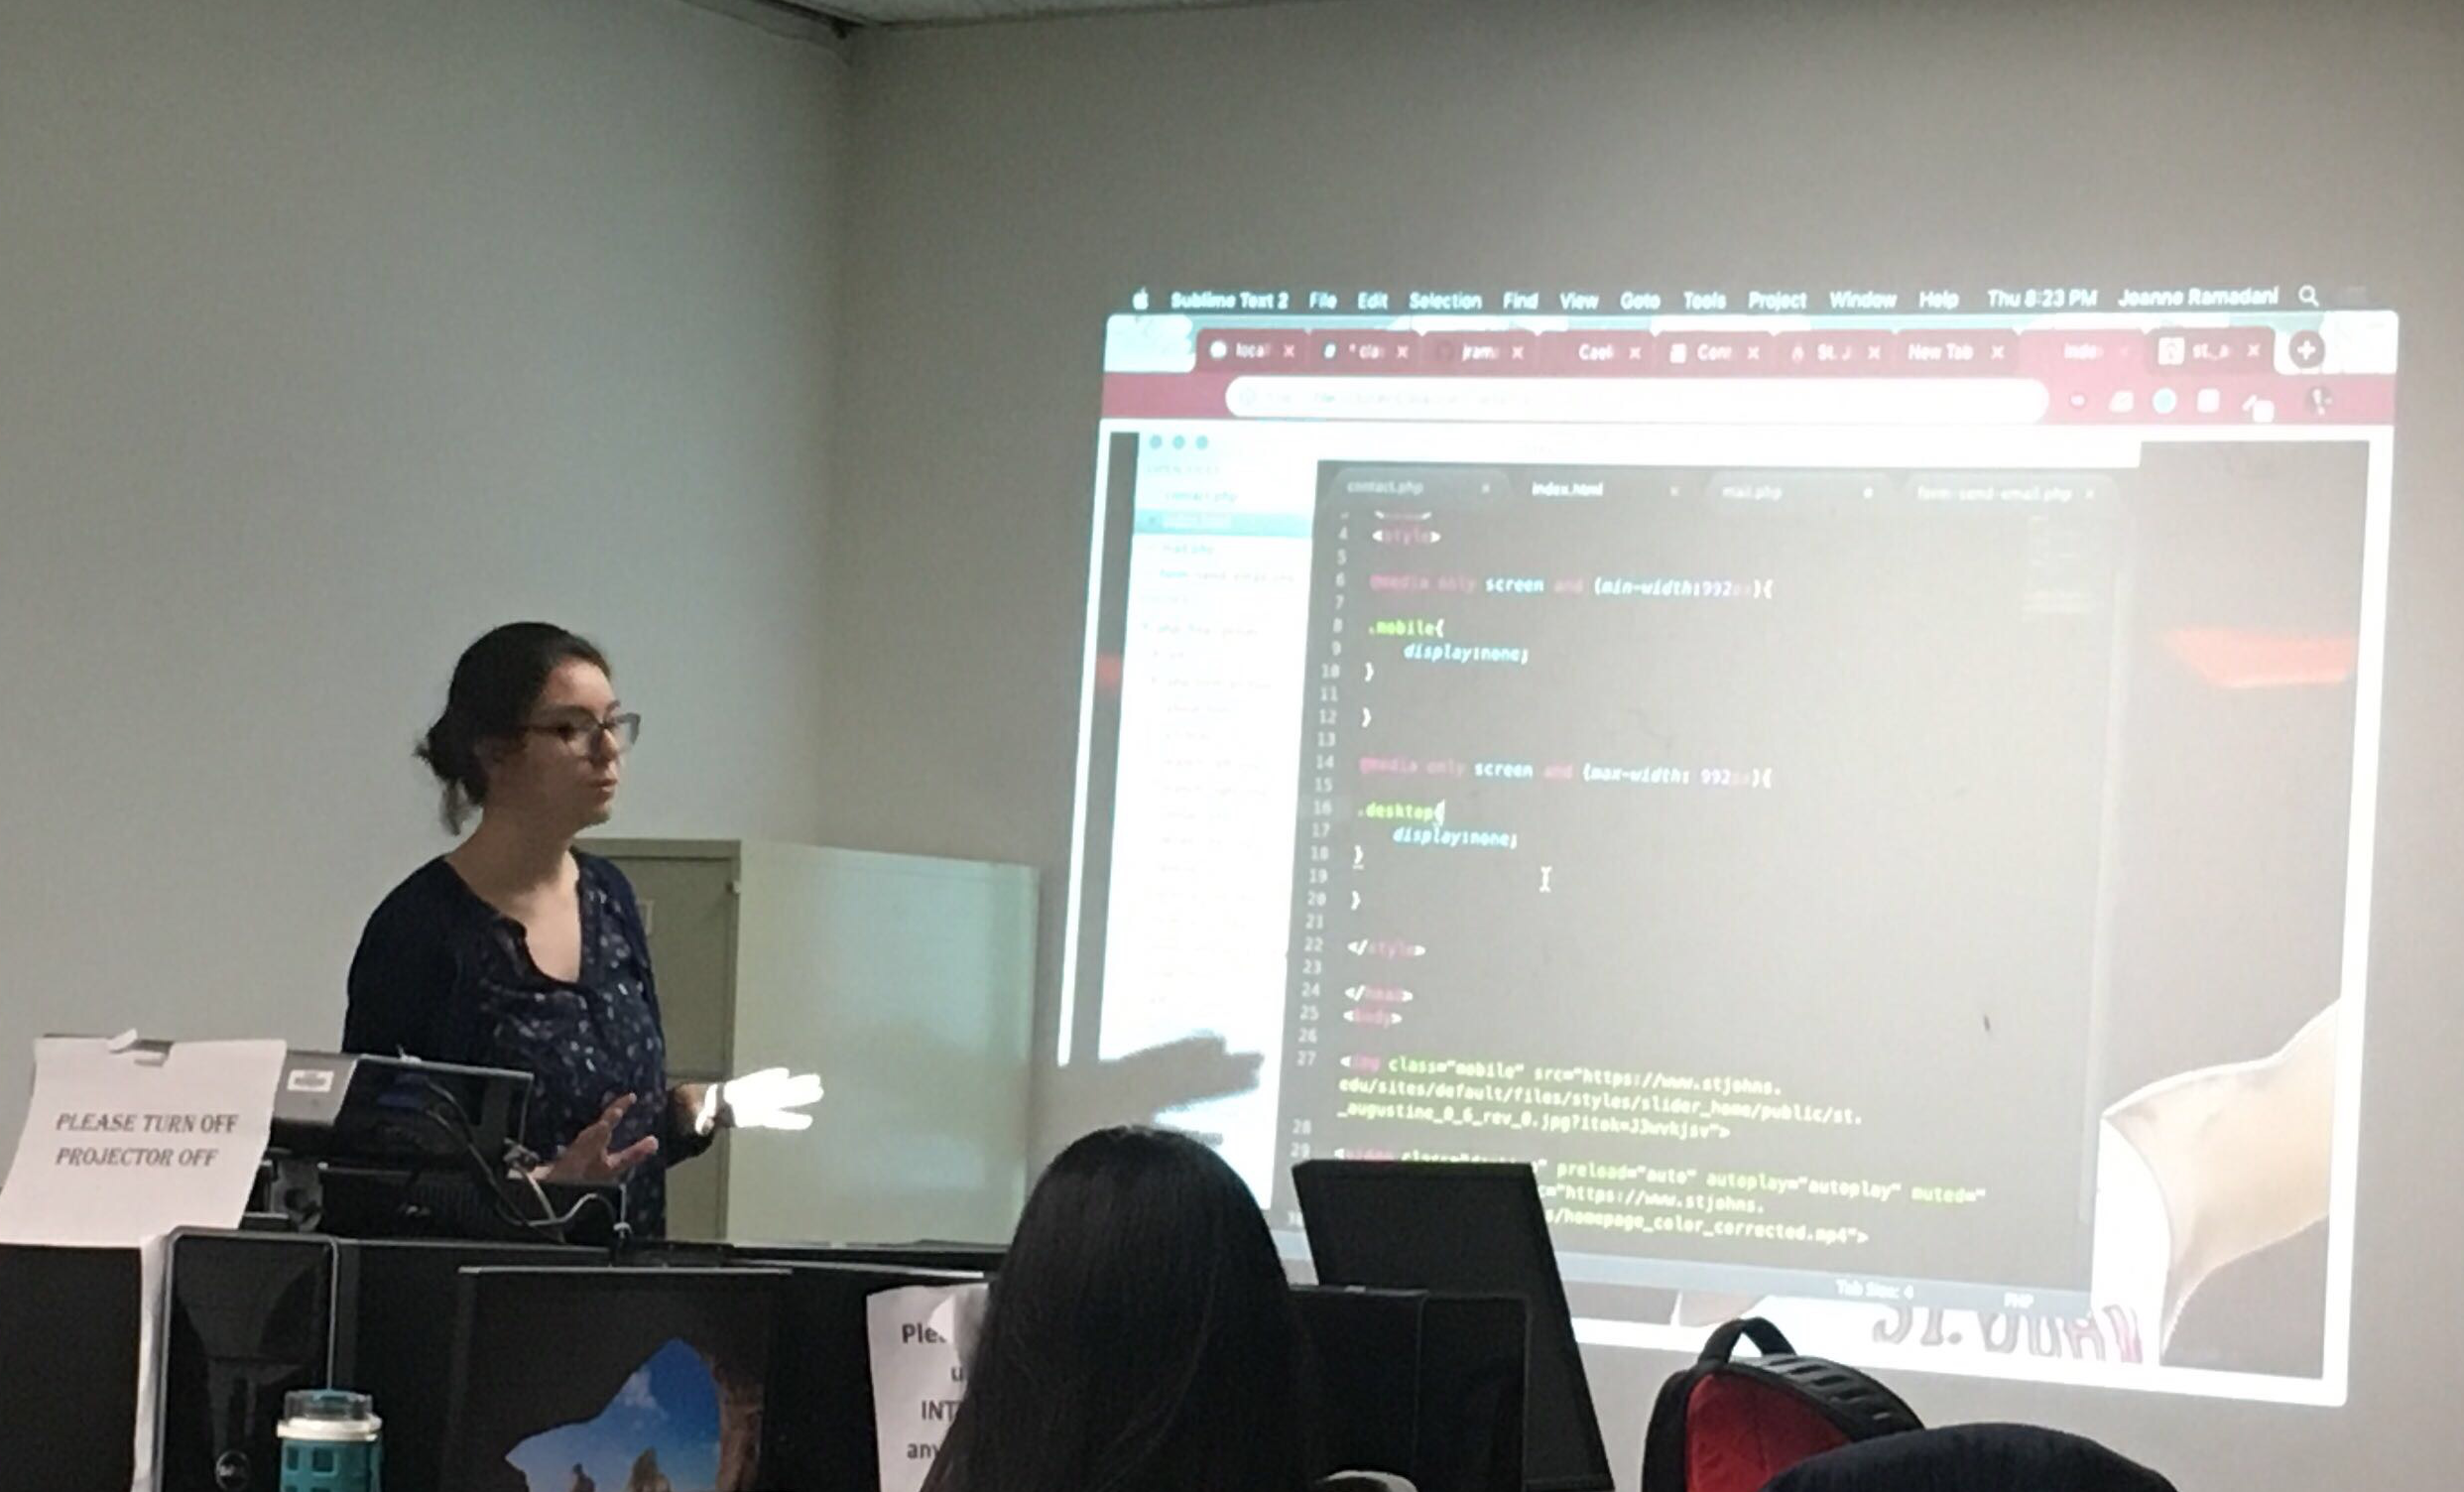
Joanne Ramadani
is a New York-based data analyst, visualization designer, and web developer.
In 2017, she graduated from Macaulay Honors College at Baruch College with a degree in English and Political Science, which trained her attention to detail and developed her logic skills. Both of those skills were instrumental to the pursuit of her Master of Science degree in Data Analysis & Visualization from the CUNY Graduate Center, which she earned in February 2022.
When not building websites, scrutinizing data, or creating fun vizzes, you can usually find her drawing, writing, or reading.
Click (or tap if on mobile) on any of the project titles to see the project in action.
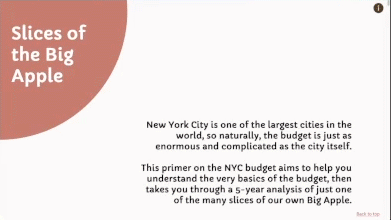
Capstone project for M.S. in Data Analysis & Visualization at the CUNY Graduate Center, completed January 2022.
Using five years (Fiscal Years 2017-2021) of budget data from the New York City Comptroller’s Office, Slices of the Big Apple takes a two-fold approach to building literacy in our government finances by first visualizing the components of the budget and its process, and then leading the audience through the data for one slice of the budget—community board funding. By choosing an interactive narrative approach to visualizing budget data, this project offers an alternative to the classic “budget data dashboard” that makes such an important part of local government accessible to all.
Tools used for the final product include HTML/CSS/JS and the packages d3.js and Scrollama.js. Data exploration and analysis work done in Python using JupyterLab (Jupyter notebook environment).
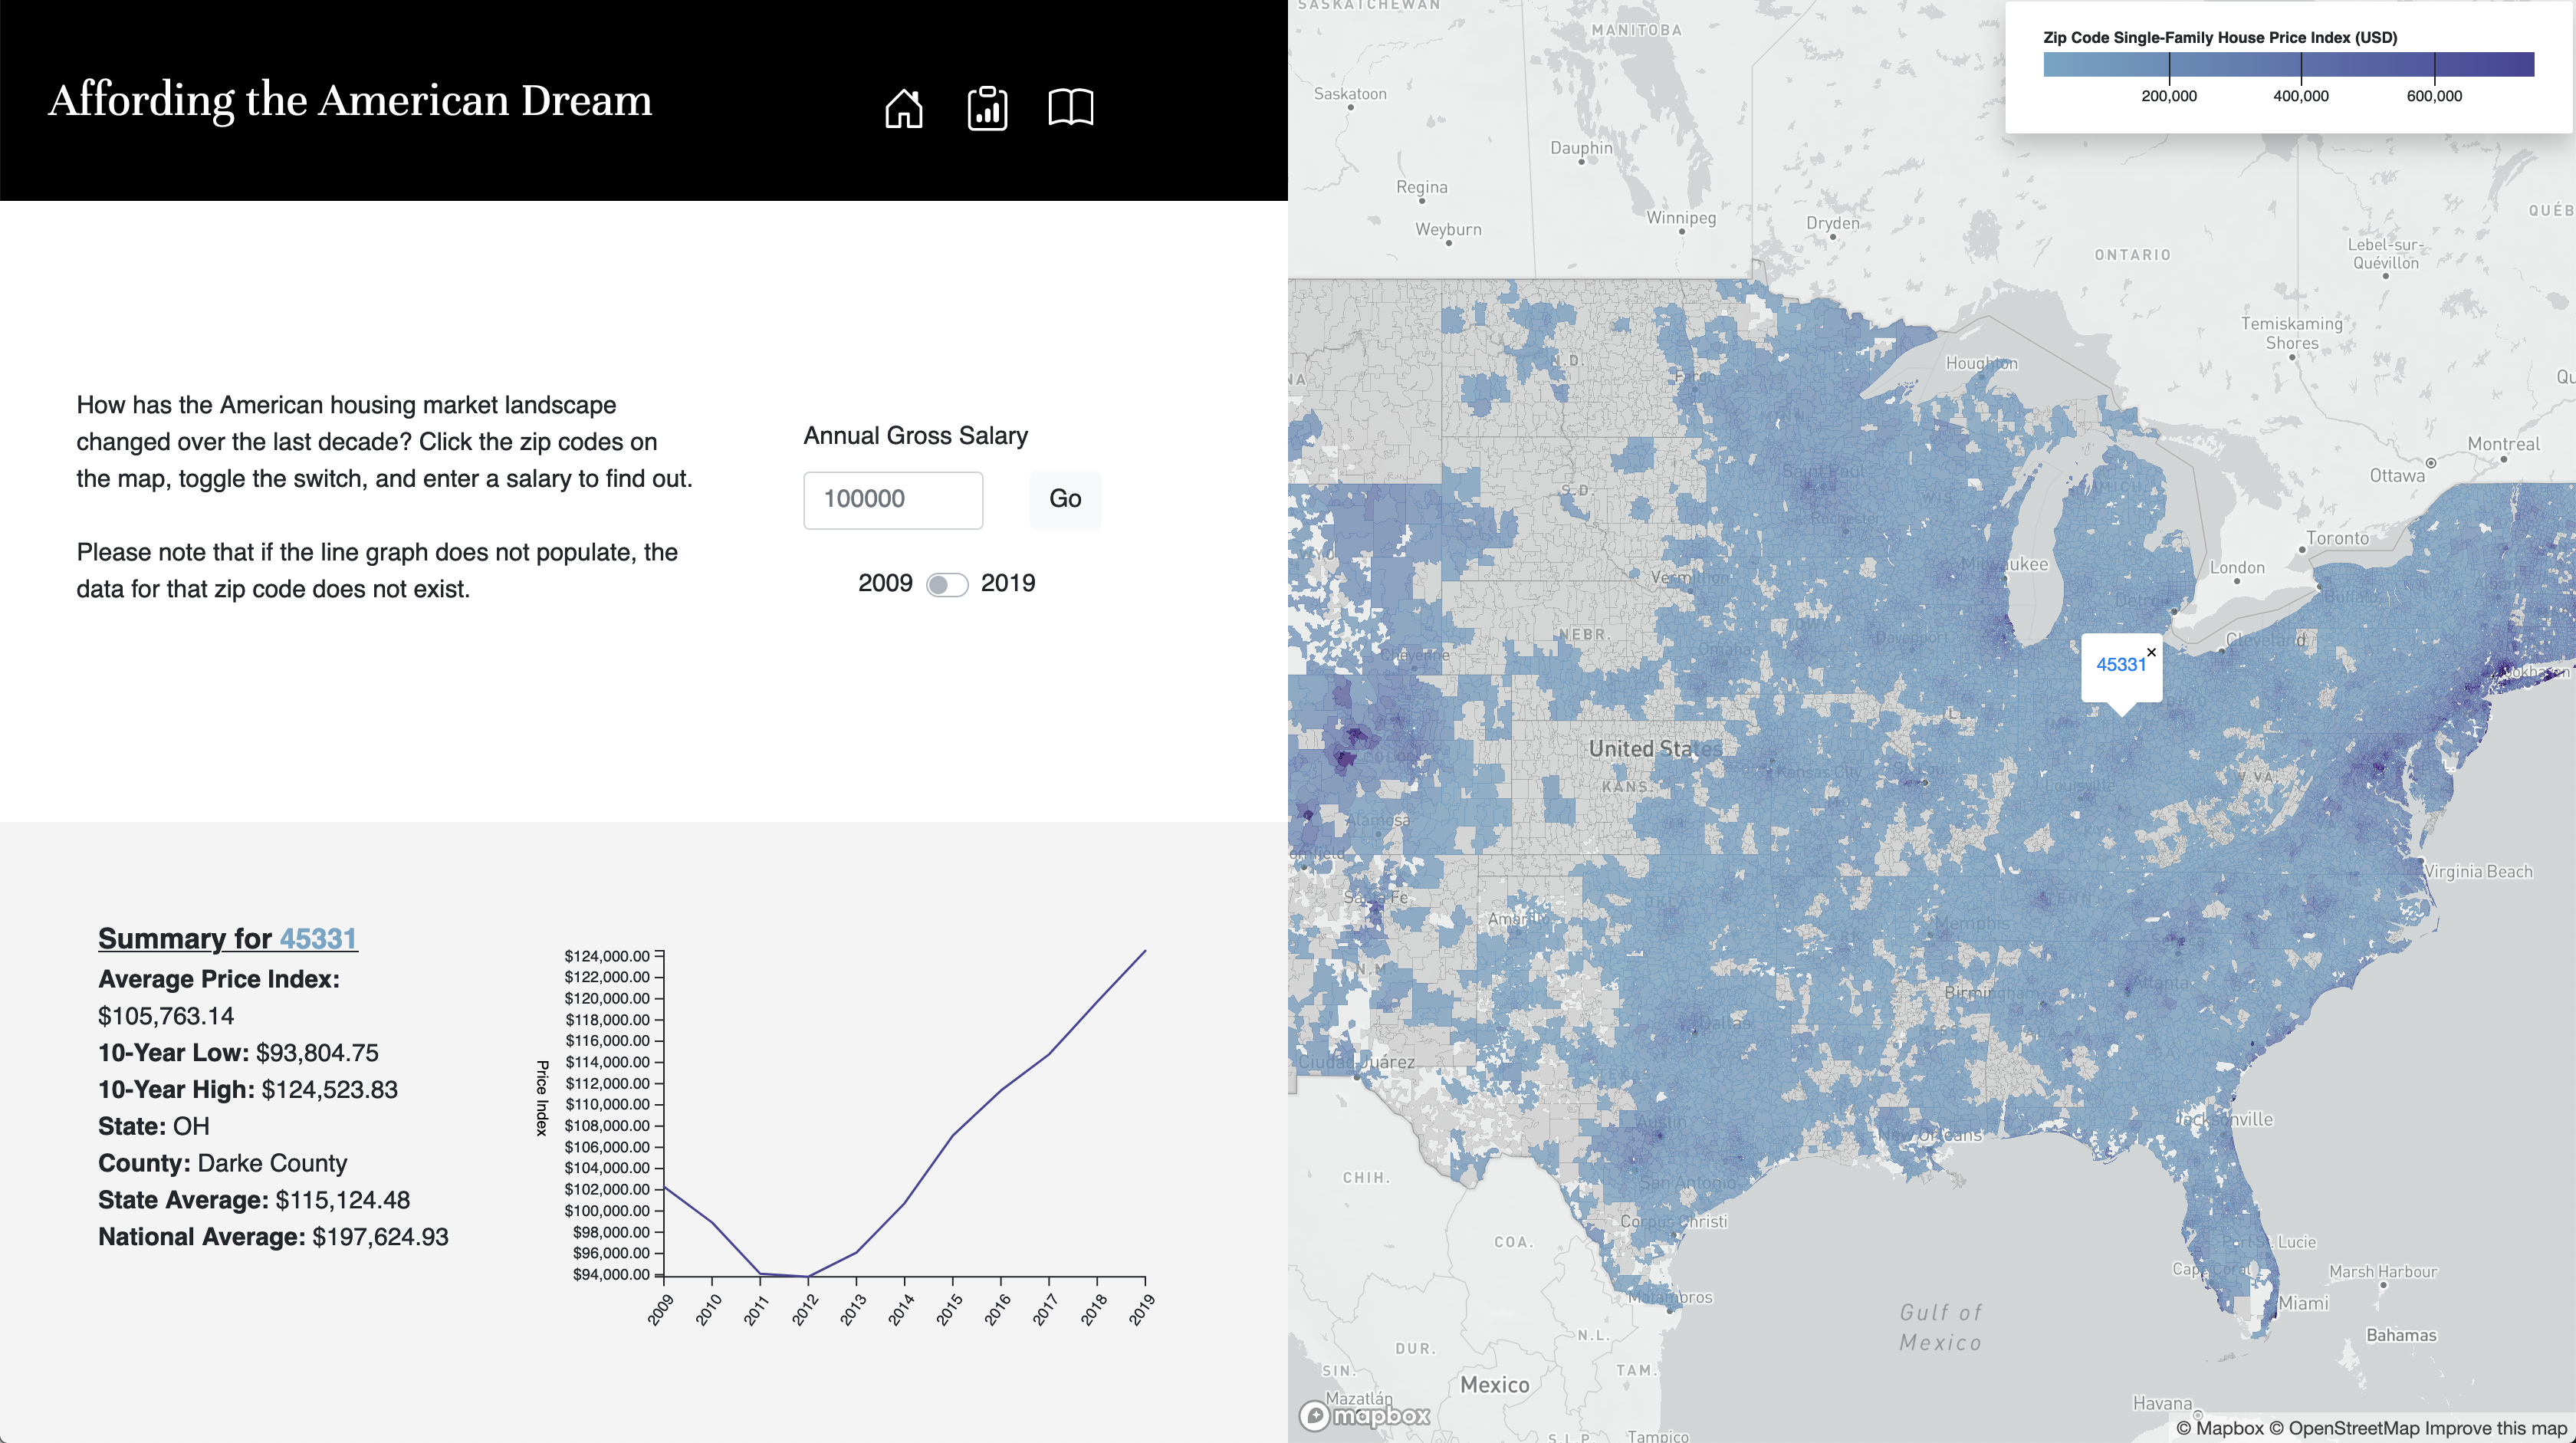
Affording the American Dream seeks to give the user an overview of the housing market over a ten year range while also allowing them to drill down into the details by zip code as a springboard into understanding the shifts of American housing values. What does the landscape of typical home values look like in the United States? What does an affordable house look like, and how has it changed over the last decade? Users can interact with the dashboard, toggling a switch for the start and end of the decade, entering different gross annual incomes, and clicking on, panning, and zooming on the map in order to dive into those details and explore how the landscape has changed from 2009 to 2019.
Tools used include HTML/CSS/JS, d3.js, Mapbox GL JS, and some Bootstrap.
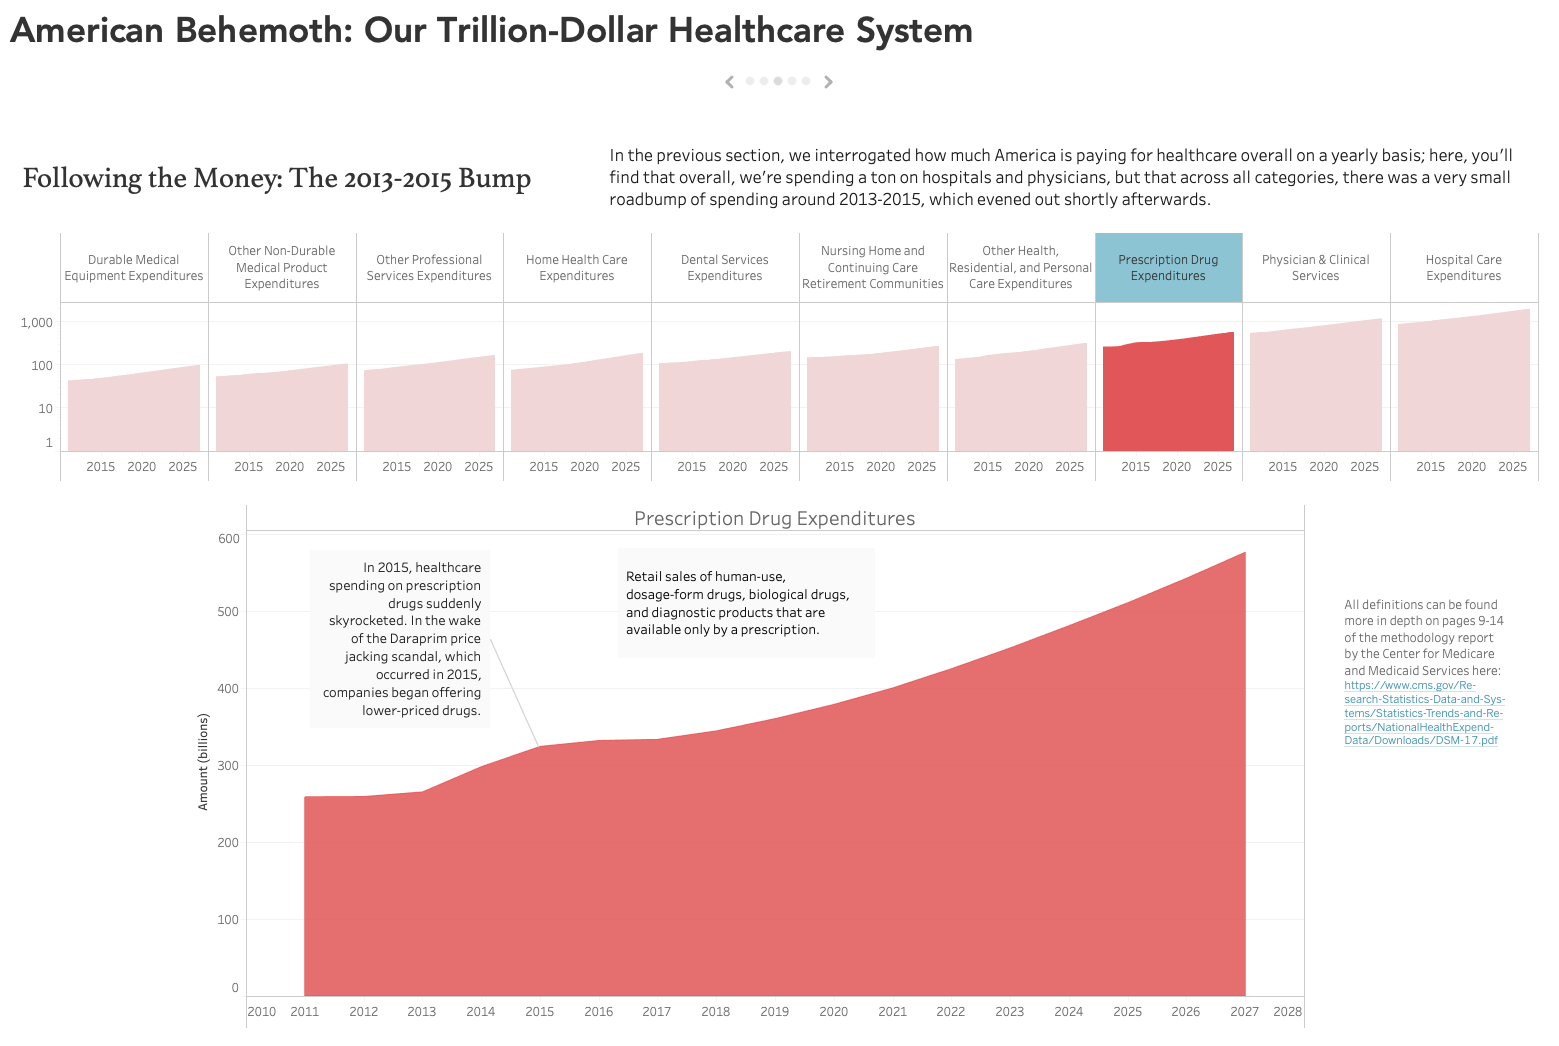
Final project for Fundamentals of Data Visualization at the CUNY Graduate Center. Using the 2017 data from the Center of Medicare and Medicaid Services, I analyzed healthcare costs and their projections from 2018-2027 in order to figure out if we'll get any relief with regard to the rising cost of healthcare.
Tools used to build this project include Tableau Desktop Professional.